12/21/12: Well the world didn't come to an end on Friday so now back to reality. Interestingly, as we approached the significant date we saw both 'fear' currencies (US Dollar & Jap. Yen) continue to sell-off. The dollar is now at key support so it should be interesting to see where we go from here. Conversely, the Yen has broken a well defined uptrend line and Asian stocks have continued to rally smartly off that reversal. One could argue that the current 'fiscal cliff' concerns have acted as a natural break on the current economic cycle. Should that be the case, and we get some sort of resolution, we may actually be setting the stage for a substantial move higher through 2013. That is a rather big assumption at the point and I for one shall let early January's price action (the January barometer) tell us what to expect for 2013. Regardless, stocks appear strong, inflation appears in check (for now) and commodity prices are relatively calm for the time being. Enjoy your holiday and get ready for a wild 2013.
While doing my WCTS today something jumped out at me. After considering this past week's price action in two market's in particular I thought a longer term perspective was needed. After looking at the monthly charts I became convinced that something of significance ought to be brought to CRI's broader reader base - hence this week's WCTS blog post. I won't tell you the market in particular now because I don't want your personal bias to impair your judgment (those shrewd investors out there ought to know exactly what market I'm talking about by just looking a the chart and reading this weeks CTS).
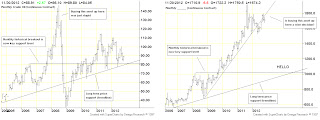
Anyway, on to the analysis. The chart to the left above is a monthly continuous contract for Nymex Crude Oil. It is important to note that energy is a 'leading' commodity. Often the broader market gets its' ques from energy prices. Once energy prices started to rally, they basically dragged the rest of commodity land (and price levels within our society) higher with them. Notice the dramatic run up in price through the period from 2004-2008 (about 4 years). Notice too the long term trend line (drawn off the significant lows). It was incredible to watch price triple what it was from the panic lows in January, 2007 ($50) up to its peak (near $150) by mid 2008 - but it did. It was just as stunning to watch the whole thing fall apart to hit a low (around $40) by the end of that year - but it did. If you had suggested such a thing prior people would have thought you were nuts - but it happened! Indeed, there were very few who could see this whole thing from start to end, but those who did catch either side made a handsome sum (regular readers will recall CRI's recommendation to buy Dec, 2008 $90 puts at $2,500 in June of 2008. That option went to over $50,000 by time all the dust settled in December). Crude oil's 'bubble' burst and it burst hard. Once it had broken, the question really was, where would it bottom? While yes the market did move beyond the long term trend line on its inital burst lower, it is interesting to see how we have basically gyrated around that long term trend line over the past couple years as the dust settles from the disaster. Additionally, it is interesting to see how the original significant monthly breakout price ($80) has acted as a magnet during the current market confusion.
So now that brings us to the chart on the right. If someone had told me five years ago that this market was going to triple (in five years) I would have thought they were nuts - but it did. I am sitting here today, wondering aloud...."if a 'leading' commodity (like energy) can do a massive 'V' top, is there any reason why this 'lagging' commodity (fear proxy) can't?"... If one draws the same long term trend lines (as Crude's) we see that current long term price support for this market is around $1000 or 40% below current levels (40%!!!!!). Additionally, price broke out on a monthly basis from around that same level when it started its run into late 2009. It took the energy market less than six months to correct back to that long term trend line - could the same thing happen in this market??? Unfortunately, I have been playing this game for so long I already know the answer, the question for me now is not 'if' but 'when'. Considering WCTS just gave a significant weekly 'sell' signal on this market, I would be very reluctant to own any asset related to this market for at least the next year or so...Furthermore, Like CRI's recent foray on the short side of the bond market (through TLT put options) I do believe there is an OnlyDouble's trade here and shall be looking in earnest for acceptable options to consider over the coming weeks.
Have you figured out which market it is, yet???
blow up this script to see the answer........................................ gold
That's all for this issue of the CTS Spotlight,
Brian Beamish FCSI
the_rational_investor@yahoo.com
the_rational_investor@yahoo.com

No comments:
Post a Comment