Sunday, August 19, 2012

CTS Spotlight Blog for August 17th, 2012

Hello and welcome back to CRI's CTS Spotlight Blog.

08/17/12: In very light holiday volume we have seen some dramatic price action through the past week. Most notably, the much stronger US jobs data (and a waning fear of recession) have put a top in the long dated government bonds and have pushed major stock indices to within shouting distance of the 
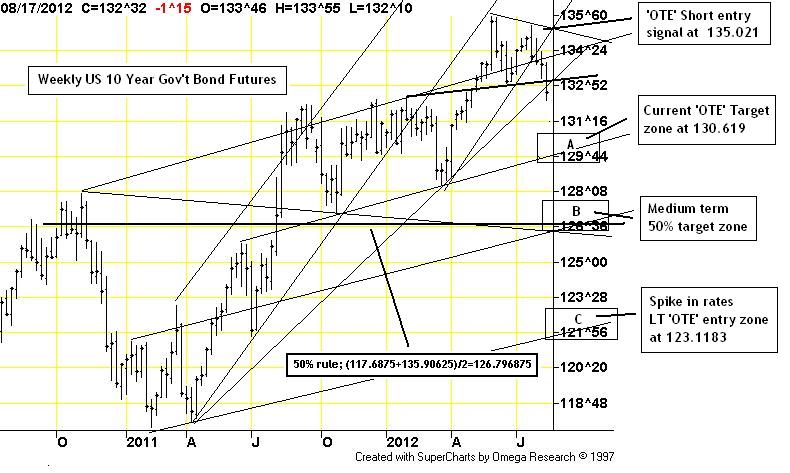
spring highs. The top in the 10 year US bond is so pronounced I have made it the subject of this week's WCTS blog spotlight. Seeming to 
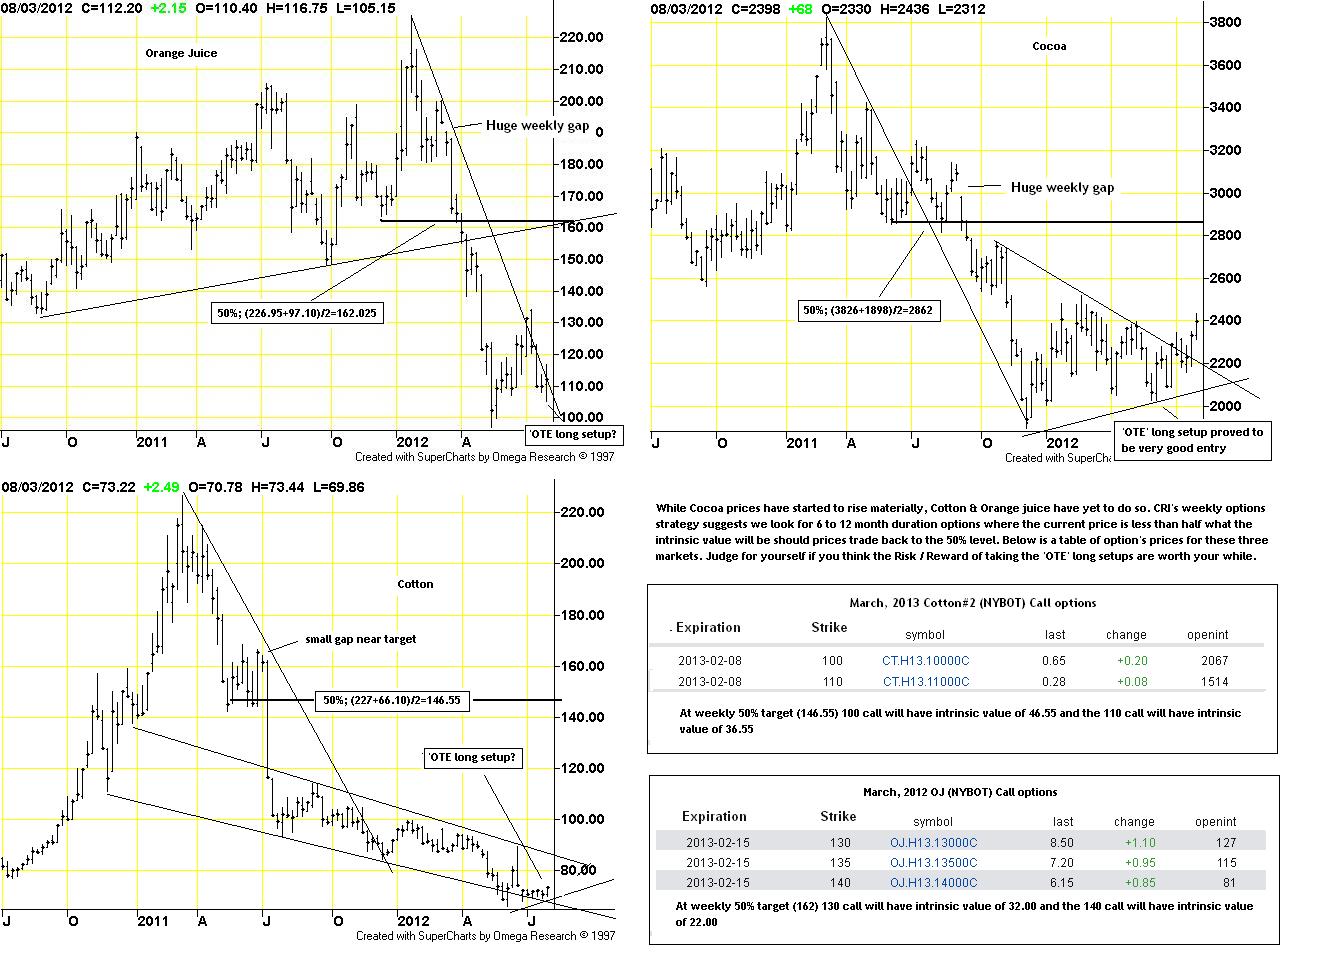
confirm this 're-flation' notion, commodity prices in general are moving higher across the board and most recent posts on being long the commodity heavy TSX 60 and in some of the Softs markets all seem to be working.


As we move our way through this 17.5 year 'fear' cycle (expected peak Q3, 2017) there ought to be a general preference towards income paying securities over growth [Please refer to CRI's Macro-economic analysis seminar for more detail]. The fear of recession (both locally within North American and globally) coupled with a credit crunch has had investors running to 'safe' assets, like US Government Bonds, for a few years now. This trend can be clearly seen in the chart above - where US Government Treasuries have enjoyed a rather dramatic bull run over the past few years.

While we know that this macro trend ought to continue for at least another five years, we also know that there ought to be pockets of 'correctionary' price action along the way. Short periods of time where the market cleans up any 'overbought' conditions before laying the groundwork for another leg higher. This is the point where I believe the market currently is. Not a new long term trend - a correction within a long term trend.

A rising bond market is in itself a deflationary situation - literally a lack of fear of inflation. The bursting of the US housing market bubble was the catalyst for the current 'dis-inflationary' spiral we are in now. Indeed, interest rates have move dramatically lower but may not clearly reflect the current situation. Economic data from North America is generally getting better as the FOMC has literally kept the gas pedal floored in an attempt to stimulate the economy. With the recent top in the bond market and an associated breakout to new highs in the stock market, one might come to be belief that the gas is finally reaching the engine.

So where might prices go over the near term if indeed there is a top in the bond market? The chart above clearly illustrates my three target zones should the recent top hold (please refer to chart above). These include a very healthy correction back into support around 130.6 (Point A.), a full correction back to the 50% level of this entire bull run around 126.80 (Point B.) and finally the 'all hell has broke loose' target back at the long term support around 123 (Point C.).

It is interesting to see that the US bond market set up an almost perfect 'OTE' short entry point around 135. It is interesting too that a move back to the refered to points above would represent interesting 'OTE' long entry areas.


That's all for this issue of the CTS Spotlight,
Brian Beamish FCSI
the_rational_investor@yahoo.com

Sunday, August 12, 2012

CTS Spotlight Blog, TSX, for August 10th, 2012

Hello and welcome back to CRI's CTS Spotlight Blog.

They say, when it rains it pours. To that end, here is yet another CTS Spotlight Blog entry for you to consider in the coming trading sessions.

There appears to be a general consensus on what to do about the European debt situation, how bad it really is and who could be potentially affected. There have also been very stern comments from the ECB suggesting they will do 'whatever is necessary' to defend the Euro-FX. Couple this 'capitulatory' talk with surprisingly bullish jobs data out of the US, a Fed ready to add liquidity (not take it away) and very robust corporate earnings and it is my belief that the late spring/early summer 2012 correction is behind us. Consider too that we do have an upcoming US Presidential election in early November. I only mention this last part because we very rarely have a collapsing market into such events. 

From a contrarian perspecitive, it is Interesting to see that even though many of the world's indices are approaching their spring highs (and in my opinion starting to point higher in earnest) there remains a rather large bearish sentiment in the market - suggesting there are still plenty of investors either short or sitting on the sidelines. Should The Dow, Nasdaq or the S&P break to new highs, we could see a mass rush of buying on the 'don't miss the boat' trade.

So why am I mentioning all of this? Canadian stocks have been hit especially hard through this seasonal correction. Because of Canada's heavy reliance on the resource sector (a volatile sector by definition) Canadian investors have to face more and more volatility in their portfolios as we head into the 17.5 year 'fear' cycle peak. It's not much fun on the way down - but oh boy it can crazy on the way up. (which of course we all know exactly when it's gong to happen - right? If you answered NO to that question maybe you should go take CRI's macro-economics seminar to brush up on your fundamentals). Times ought to be very good for Canada in general over the next five years but any news/fear of recession in the US can/will lead to dramatic month-to-month price swings like we just saw over the past 4 months. Recent upbeat US jobs data, a very healthy yield curve and strong corporate profits are not the hallmarks of recessions and I do NOT believe the US is there at the moment. Once the US election is over and we are facing 'the fiscal cliff' I believe all bets are off and am probably going to suggest going to 'cash' at that point. But that is four months away and over the interim prices look to be heading higher - not lower.

So now on to the chart. The first thing that jumps at me is the fact that the 50% level is almost 40 points higher than where we are now. Yet the recent lows are only 20 points lower. That would represent a 2:1 risk reward model. Addtionally, this market is current within both the 2 year and 1 year 'OTE' zones suggesting again that the risk/reward model is tilted towards the reward side.  

I would advise taking some time over the coming week to look seriously at 6-12 month call options (on your most favored ETF proxy....for me probably the XIU March, 2013 $17 call currently $1.05 offered TMX link or about twice what I want). If I can find one where the price paid today is half (or less) what the intrinsic value of the option will be should prices move to the 50% level, I might just pull the trigger - seems like an interesting OnlyDoubles trade, no????

That's all for this issue of the CTS Spotlight,
Brian Beamish FCSI
the_rational_investor@yahoo.com

Sunday, August 5, 2012

CTS Spotlight Blog, Softs, for August 3rd, 2012


Hello and welcome back to CRI's CTS Spotlight Blog.
Since I had the time this week, and I see some startling opportunities out there in the market, I thought I would post my thoughts on the 'softs' market in general and point out two intersting opportunities developing within the sector.
So here is my CTS summary for the week of August 3rd, 2012:
 08/03/12: After a week's hiatus, we are back in the saddle! In what appears to be a rather normal bounce (coming out of the seasonal trough of late spring/early summer) commodity prices in general are moving higher. ECB help from Europe, better employment data from North America and stabilization from Asia all seem to be supporting the idea of higher, not lower prices going forward. Some rather aggressively (grains), others mid stream (energies) while others seem to be just getting started (softs). Indeed, Softs got hit very hard through the correction and look to be offering some very interesting risk/reward potentials here. For more on that please refer to this weeks WTCS blog post.
Specifically, I am refering to Orange Juice and Cotton as outlined in the chart and associated tables below:
Both of these markets have yet to respond to the broader market bottom of late. While I am not an outright bull on either market yet, it is interesting to see the 'OTE' trade idea at work (In short, taking a position at or near a 70.5% retracement of the consolidation range and risking a break of the significant range pivot). You can see how OTE suggested getting long cocoa several trading sessions ago and now we seem to have a working uptrend there. Can either OJ or Cotton do the same? At these risk levels (Cotton: .65 risk for 45.00 potential reward!!!!!! & OJ: $8.50 risk for $32.00 potential reward) is it not at least prudent to consider the trade. From a fundamental perspective, either one good 'hurricane fear' or a little of the grain misery passed on to cotton growers and either one of these markets could spike back to their respective 50% levels and most probably back to filling in their rather weekly price gaps.

That's all for this issue of the CTS Spotlight,
Brian Beamish FCSI
the_rational_investor@yahoo.com