Saturday, July 28, 2012

CTS Spotlight Blog, Indian Rupee, for July 27, 2012

Hello and welcome back to CRI's CTS Spotlight Blog.
 
Since trading Crude Oil in earnest for the past six months (please refer to CRI's DayTradingBlog) I must admit I have been letting this blog slide a little of late. 

So for something a little different, I thought I might use this platform to take a look a specific markets as they come to my attention.To that end, this week a friend of mine asked for my thoughts on the Indian Rupee. Frankly, I have always been a little suspect of this currency trading unit and wouldn't be inclined to 'invest' my hard earned dollars into it directly. But considering the myriad of North American based ETF's and other such products, it seems only prudent to at least be cognizant of what is going on. 


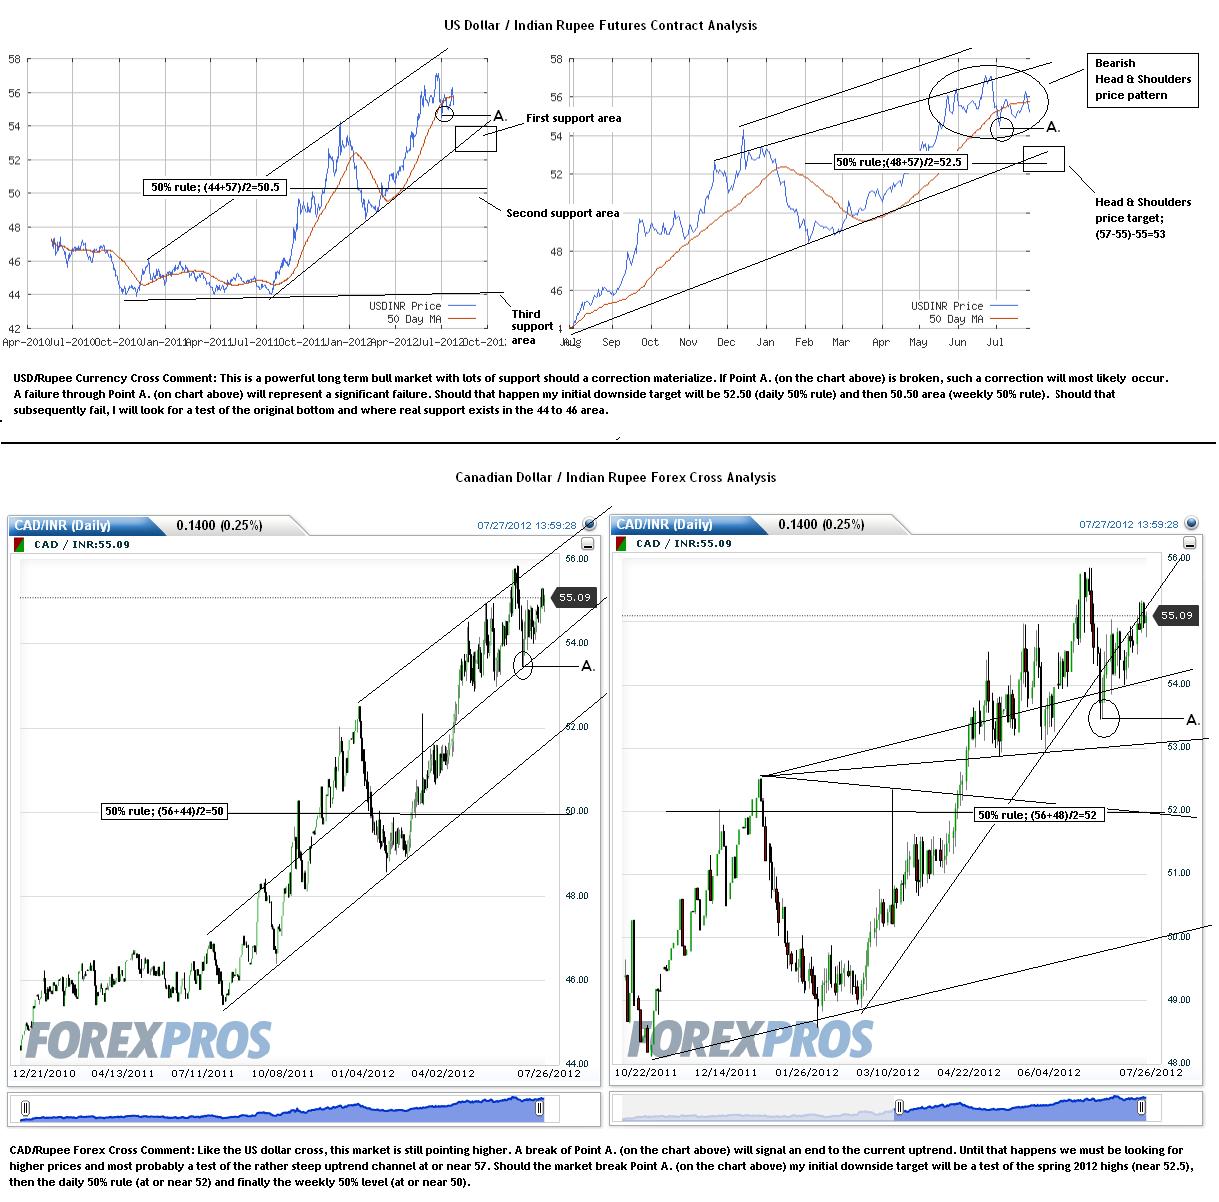
On first blush my knee jerk reaction was to be looking for a top. Yet one fatal mistake many novice traders do is to assume a change when there really isn't one. So, while my hunch is we need to come back to the daily and weekly 50% levels and clean up what appears to be an overbought market, there is NO top in place on either the US or Canadian crosses. One must still be looking for the recent highs to be tested and then if broken, the respective uptrend channel lines next.

On a side note, it is interesting to see such strength in the face what appears to be world wide weakness. This, in itself, is quite bullish and does suggest one ought to be looking for substantially higher prices to come. Is India becoming a reserve currency in itself? While that may be stretching things a bit, the internal Indian economy seems to be offsetting overseas weakness. While 'reserve currency' status may be years down the road, we at least know that for the next 5 years (give or take a quarter or two) this country will have the wind at its back and not in it's face...

Trading perspective. While this market is clearly trending higher, one must be weary of buying into risky markets. I could easily see the daily and weekly 50% levels tested in earnest and still feel like this market is trending higher. To that end, new purchases of either unit ought to be put on hold until some sort of 'clean up process' happens. Those that are long should be looking to take at least partial profits on existing positions (if you haven't already done so) and enjoying a free ride on the remaining (and what should be relatively 'risk free') positions.


That's all for this issue of the CTS Spotlight,
Brian Beamish FCSI
the_rational_investor@yahoo.com

Sunday, April 29, 2012

CTS Spotlight Blog, Canadian Dollar, for April 27, 2012

04/27/12: The first signs of a crack in the US Dollar Index showed this past trading week. While a collapse is a little premature to predict, the break does suggest the much anticipated change in US Fed policy may still be quite some time to come. Indeed, confirming this notion, US Long dated Treasuries have reversed their recent breakdown and have pushed to new highs. Interestingly, the Canadian dollar has bottomed vs. the Greenback as Canadian bonds have not broken their recent top and on word from BOC Governor Carney warning the Canadian public to expect higher rates there soon. Additionally, Crude Oil looks to have found support just above $100/barrel which is interestingly often led/supported by the Canadian and Australian dollars (the commodity currencies). 


This week I thought I would take a good look at the Canadian dollar since I made reference to it so much in the weekly CTS. 

After putting in a well defined double top pattern through the spring and summer of 2011, the Loonie promptly gave back the entire bull run of the previous year in a matter of a couple months. Importantly, the Loonie did not break the previous significant monthly low (92.13) suggesting the longer term bull market was still in place. As it appeared that Europe's debt issues had for the time being been contained within Europe, the Loonie quickly took back a good portion of the sell off and has spent the better part of the past year oscillating between the lows and the 50% level. As energy prices have improved so too has the broader Canadian economy as well as the prospects for significant infrastructure spending going forward. The anticipation of such spending has created a whirl wind of activity within the western portion of the country. So much so that BOC chairman Carney recently warned Canadian's of higher short term interest rates to come. Additionally, Canadian long dated government bonds have not broken out as have their US counterparts suggesting any slowdown south of the boarder shouldn't be too constrictive on Canadian GDP.

As a direct result of this relatively rosy outlook for the Canadian economy, the Loonie has started to appreciate vs. the Greenback. On a short term basis, we have broken through recent peaks suggesting prices do want to move higher. While the short term bull flag I have outlined does suggest a move north of 104, on further inspection it does seem a little conservative of a target. I wouldn't be surprised if we shot a little farther than 104 then consolidate around the 104 area. Should be move through 104 cleanly (or on a subsequent breakout after a consolidation), a serious test of last year's peak (just above 106) seems likely.

A couple of side notes I would make here:
As a student of the market for more than 15 years, I have noticed that the commodity currencies in general lead basic commodity prices. Those currencies in particular are the Canadian and Australian dollars. Both are pointing higher at the moment which does support the notion of higher raw commodity prices in general going forward. This should be a helpful tool for all those that follow CRI's day trading blog on Crude Oil and does confirm our basic thesis that Crude prices are pointing higher too in the short term.

2. Interestingly, Asia had been the significant driver for world economic growth over the past decade and the Australian dollar was a direct beneficiary (almost doubling in value vs. the US dollar over the time period). As Europe flounders in its sea of debt and China appears headed for a harder landing than was expected, It appears in the short term North America (and particularly North America ex. USA) is currently the best place for economic growth going forward. Does that mean we could see the Canadian dollar rise materially vs. the Australasian dollar? Is this a spread trade in the making? Further research does seem warranted...

That's all for this issue of the CTS Spotlight,
Brian Beamish FCSI
the_rational_investor@yahoo.com
http://www.therationalinvestor.ca/RI_Tradents.php#wctsspotlight
http://www.therationalinvestor.ca


Sunday, February 19, 2012

CTS Spotlight for the week of February 17th, 2012: Japanese Yen

02/17/12: While the US dollar index is little changed this week, the Japanese Yen has broken down materially. The long standing bull market has reversed and suggests it may need to go through a natural correction process of the recent multi-year run. Coincidentally, a bottom has formed in the Eurodollar market. While rather wide, it does suggest that the credit crunch begun last year has abated for the time being. If this is indeed the case (the reflation of the world economy) the notion does support a Yen bearish stance and further appreciation of both equities in particular and commodity prices in general.


This week I thought we ought to take a good look at the Japanese Yen. If one is to believe that a top has formed in the Yen (double top breakdown currently working from 12783) then there may be far sweeping fundamental implications going forward. The Yen itself has been quite a rise over the past few years. Since the US Federal Reserve lowered its key borrowing rate into the same range as the Japanese, there has been a definite preference for the Yen over the Dollar. The new 'safe-haven' flow pushed the Yen to rise to historic levels, but that may be changing. As mentioned above, the fact that the Eurodollar market (which is the US corporate short term interest rate market) has bottomed and equity prices are pressing historic highs suggests fear is leaving the market and that the world is reflating once again. In short, the 'safe-haven' trade seems to be over for now.

So if indeed the 'safe-haven' trade is over for now, where ought one to expect to see the Yen move to over the coming weeks/months ahead. My primary target here is a 50% retracement of the past 2 year move. Currently that 50% level is in and around the 11900 area. Considering the short signal came in on a move through 12783, there is a potential 800 plus point gainer here. One ought to risk up to recent resistance (the highs from 3 weeks ago at 1.3134) or about 350 points. This trade represents a greater than 2:1 reward to risk ratio so is definitely worth considering. Should we get a daily bounce into resistance and then some sort of failure I will look at a June 121 put option (currently 0.00970). At 11900 this option will have an intrinsic value of .02000 or more than double today's price - but I think we can get it a little cheaper

That's all for this issue of the CTS Spotlight,
Brian Beamish FCSI
the_rational_investor@yahoo.com
http://www.therationalinvestor.ca/RI_Tradents.php#wctsspotlight
http://www.therationalinvestor.ca


Sunday, November 27, 2011

CTS Spotlight for the week of Nov. 25th, 2011: Swiss Franc

11/25/11: The credit crunch that began some sixteen weeks ago continues to play itself out. Short term US corporate interest rates (as measured by the Eurodollar futures contract) continue to climb while central banks keep government guaranteed yields at historic lows. Considering this is a European debt problem it should not surprise to see the Euro currency itself continue to flounder vs. the US dollar. Interestingly, since the Swiss pegged their currency to the Euro, it now has rolled over in earnest and is currently pointing much lower too. Elsewhere, select soft markets and the whole grain market have begun to collapse (as suggested here many times over the past few posts) indicating international demand is waning at these lofty levels. Weak demand, a strong local currency and out-right fear are dominating the commodities landscape - bulls be careful.

This week I thought we ought to take a look at one currency (vs. the US Dollar) that looks especially vulnerable, The Swiss Franc. Since the news of Switzerland's 'pegging' of its local currency to the Euro there has been a dramatic shift away from this once considered last bastion of security. Because of the peg (currently at 1.20 Sw. Franc/1 Euro) the Swiss believe they can control a run-away deflationary spiral that so often affect's countries with rapidly rising currencies. The irony of this belief is that they may indeed get a falling currency, and maybe even a bit more. The chart above is a classic example of what I like to call 'too far too fast'. The end result of these violent moves is often going right back to where the breakout started from. The recently confirmed massive bear flag pole formation (indicated on the chart above) seems to confirm this potential outcome. The rally that kicked this whole move higher off started at 85.73 and the bear flag pole formation target currently sits near .87. The fact that the market has consolidated at the 50% level and subsequently failed further supports this conclusion. So what may cause such a dramatic turn? Firstly, we are well aware of the fact that we are very firmly with another 'credit crunch'. Fear is dominating and when it does, people run into the only thing they can really trust - and for now that still remains the US dollar. Couple this macro backdrop (money moving away from Europe and towards safety) with local political meddling and one can easily see this scenario play itself out. Indeed, of late there have been more calls from Swiss politicians for an even greater devaluation of their currency peg with the Euro - with 1.3 and even 1.4 being tossed around (news link).

So couple local politics with an already weak Euro backdrop and we have the makings for the complete unwinding of a previously violent bull market. Additionally, the charts do confirm this fundamental outlook. The Swiss may indeed get exactly what they want (a weak currency) but the jury is still out on weather it will solve their domestic economic troubles.

That's all for this issue of the CTS Spotlight,
Brian Beamish FCSI
the_rational_investor@yahoo.com
http://www.therationalinvestor.ca/RI_Tradents.php#wctsspotlight
http://www.therationalinvestor.ca

Saturday, November 12, 2011

CTS Spotlight for the week of Nov. 11th, 2011: Oats

11/11/11: Fear has taken over the currency markets as every uptrend vs. the US dollar has either failed or outright reversed. US short term corporate interest rates continue to climb as the 'Ted spread' widens. The fundamental seeds for further price deterioration are being sown, is anyone listening? In the commodities markets in particular, many of the previously strong uptrends have either broken or are starting to look vulnerable. This can be especially seen in the grain markets where Oats (as a good leading indicator) has just confirmed a very bearish price patten with this week\'s price action (and is the subject of our WCTS Blog). The only exception appears to be in the meats, where both Live and Feeder Cattle look especially strong. This too though makes sense given our outlook for grain prices.


In polar opposite to last week's blog write-up, the current Oats chart is a definition of bearishness. There are so many reasons to look for prices to correct over the medium term one really doesn't know where to begin. From the fact that the 50% rule suggests prices need to come back to the 307 area; to the well defined downward pointing channel that suggest real support currently sits in the 250 area; to the gap way down at 225, there are plenty of reasons to look for lower prices in this particular grain going forward. Today I am going to comment on what I consider to be the final 'nail' in Oat's 'coffin' - that being the confirmation of a short term bear flag pole formation (with the intra-week move through the October low of 321).
From a short term traders perspective, one really loves the see tight, well defined short term price patten. It give the trader an ability to get in and out in a short period of time with very well define price targets. The breaking of 321, in my opinion, represents such an event. The failure of 321 is often refereed to as a bearish flag pole pattern (as one can see on the chart above). The price objective (284.50) is 37 cents away (at $50/pt is $1850) while the risk (to just above 345) represents about 24 points (at $50/pt is $1200). I personally would like at least a 2:1 profit/loss ratio to consider a futures trade. To that end I might look for a rally into the 330s to put the short trade on where a move to above 345 would stop me out but at a much smaller loss. Having said that, I have seen markets collapse on the confirmation of a bear flag patterns so at the very least lets watch and see what happens. Another alternative might be to consider a Put option. March, 2012 Oats (chart link) has a similar price pattern where it's bear flag target is [bear flag; 354-(398-331.5)=287.5]. Currently, the March, 2012 $300 put is 4.75 points ($250). At the target, this option will have 12.5 points ($625) of intrisic value or more than twice the price we can pay for the option today. Considering that the option has a little more than 3 months to hit the target, buying this put option to me sounds like a reasonable risk. To that end, I shall be looking into this trade in earnest in the coming week.

That's all for this issue of the CTS Spotlight,
Brian Beamish FCSI
the_rational_investor@yahoo.com
http://www.therationalinvestor.ca/RI_Tradents.php#wctsspotlight
http://www.therationalinvestor.ca

Sunday, November 6, 2011

CTS Spotlight for the week of Nov. 04th, 2011: Cattle

11/04/11: The US dollar index rebounded after filling in a gap that remained on the downside. This rebound came on the heels of a massive intervention by the BOJ. Last week we commented on the relentless charge higher by the Yen. Monday saw the Yen break through key support on the intervention. That long position should be stopped out but once the dust settles, the Yen looks to be headed back up to the highs and my expectations, even further. Elsewhere, the cattle market has registered a massive breakout in both Live Cattle and Feeder and is the focus of this weeks CTS blog. One ought to expect much higher prices there going forward.


This week I thought we would take a look at one of the few markets that is moving higher in earnest, regardless of the US dollar's trend. Meat prices have lagged the broader market's inflationary action over the past few yeas. Over the past few years we have seen Corn go from $3 to $6, gold from $750 to $1500 and crude from $50 to $150. Meat prices however haven't moved in such a manor. I believe that it is the meat's turn now. 
From a cost perspective, grain prices are current very weak and any further global economic uncertainty shall reduce demand for already dramatically inflated prices. This is music to a cattle farmer's ears. As the price of grain falls, the carrying cost of herds fall too. Couple this fundamental situation with an already tight supply of cattle and we have the makings of a bull market. Since farmers are not being pressed to sell their herds and they see rising prices, they have incentive to keep their herds in the hopes of seeing higher prices in the not too distant future. In essence, the spiral feeds on itself. Higher prices means less supply to market means higher prices etc.

Technically speaking, this chart is one of the most beautiful one's a technician can see. Simply put, prices are moving from the lower left to the upper right in a very consistent, steady fashion. Market's often 'go parabolic' near the end of moves, we see no parabolic action here which suggests we are a long way away from the end of this run. Specifically, traders were given a huge buy signal this past week when prices moved through Spring '11 highs (122.60). The formation itself suggests we will see at least another $.10 higher in the short term (where each point = $4 so $.10 = 1000 points = $4000 per contract).

Notice that this market actually gave you a chance to get in before the massive weekly breakout. CRI got a nice double bottom buy signal 13 weeks ago at 115.50. This position is up almost $4000 itself and yet I think we are just getting going here rather than nearing an end. Regardless of where you are long, enjoy the ride because it looks like this market is just now starting to heat up in earnest.

That's all for this issue of the CTS Spotlight,
Brian Beamish FCSI
the_rational_investor@yahoo.com
http://www.therationalinvestor.ca

Sunday, October 30, 2011

CTS Spotlight for the week of Oct. 28th, 2011: Canadian Dollar

10/28/11: As the US dollar continues its pullback from the recent panic-highs few new trends have been establish amongst it's major trading pairs. Of note this week, the Jap. Yen continues the relentless charge towards its bull flag target and both commodity currencies suggest more rather than less volatility ought to be expected in the coming weeks/months ahead. As the world pulls back from the proverbial brink, downward price pressure has eased momentarily across the board and especially so in equities. This new money has to be coming from somewhere and it looks like the longer end of the yield curve is where it is coming from. While the bottom continues to hold in the US Dollar index, one might consider this entire market move to be nothing more than relieving a short-term oversold condition.


Since the Canadian dollar is such a good proxy for the commodities markets in general, I thought we would take this week to look at what the 'Loonie' is doing and where one ought to expect this one particular currency to go over the coming weeks/months ahead. Just as important, one ought to appreciate the message the Canadian dollar is sending the market as a commodity proxy. 

The first thing that jumps out at me when I look at this chart is: wow, what a drop!. And now, what a rebound! If one had respected the 50% rule through last year's rally, one ought not to be too surprised that prices needed to cool down. Indeed, this currency appreciated more than 14.5% in a little more than 1 year. That kind of move certainly wasn't sustainable, and indeed, prices did begin to correct into the typical seasonal peak of late spring 2011. One can never know exactly where a bottom will come in on a correction and here is a case where the markets dramatically over shot the downside target. Indeed, we went all the way back to the original double bottom lows (92.40) to find buying support through the panic sell-off of late Sept./early Oct. In just as violent a move, we bounced of those panic lows and now sit just a bit above the original downside target - the 50% rule of 99.155.

If one had done the short trade coming out of the seasonal peak, one ought to have taken profits. The fact that the market overshot the correction target by more than 5 cents should be nothing more than extra gravy for your already handsome winnings. If one hasn't taken profits one really ought to ask themselves what the risks are going forward. Ironically enough, when looking at the chart from today's perspective, one gets the feeling that the risks are almost exactly 50/50. 

I find it interesting that the more I study charts, the more I see the market from a symmetrical perspective. There seems to be a poetry to price action and here again is another good example. Notice how the 50% level almost seems to be a pivot. We seem to have swung violently above and then below but ultimately end up back at the 50% rule. Notice too the sizable gaps left at the extremes (just under 1.05 and just above .96). This suggests to me we may take quite some time bouncing in between these two points. Considering how close we are to the 50% level, one might argue that there is almost an exactly equal amount of risk vs. reward with going long or short from where we are now.

So in summary then, as with many other commodity markets and commodity related currencies, there was a fabulous short trade that developed through the seasonal peak of 2011. That seasonal trade is behind us now and it appears that also like many other markets, the Canadian dollar is now quite comfortably into a 'clean-up' phase. Given the violent price action seen over the past few months and the fact that at both extremes gaps were left on the chart, one can realistically expect a 5% swing in either direction from current levels. This is historically a very high rate of volatility and should be respected. Fortunes can be made and lost in times like these so prudence is key in any market call. I don't see an easy trade here so what is the point in taking the risk....

That's all for this issue of the CTS Spotlight,
Brian Beamish FCSI
the_rational_investor@yahoo.com
http://www.therationalinvestor.ca